
The graph that tells an undeniable story and one that we all need to take in, especially at this time of year.
Here’s a performance graph well worth having a look at it. There’s a very simple message in here for everyone who cycles, especially at this time of year.
The graph contains the performance data of Tadhg de Barra.
He returned to cycling this time last year after a near 10-year break from the sport while he pursued his main sport of marathon kayaking.
But he wanted to ride the Rás in May so he got training and into the shape required for cycling; dropping his weight from around 80kg to 69kg.
He went from A4 to A1 in four months and rode the Rás with Waterford Comeragh.
Advertisement
Because that race was his goal – the very reason why he was coming back to cycling; once it was completed he ditched the cycling training regime.
And while he is the type to keep generally fit, he is only just getting back into performance level training to in order to resume his kayaking.
So he’s not typical of cyclists, but the graph that represents his dip in training and corresponding dip in physical capacity or fitness is what we’re interested in here.
The performance management chart above is generated by TrainingPeaks.
The pink line is his acute training load; a weighted average based on the previous seven days training. It’s an estimate of fatigue based on the training load of the previous two weeks.
The blue line represents chronic training load, or fitness. It’s an exponentially weighted average of the last 42 days of training stress.
It takes into account the fact that the training you did more recently has more of an impact on your current condition than training you did earlier in the 42-day calculation window.
And on TrainingPeaks when you subtract yesterday’s fatigue (acute training load) from yesterday’s fitness (chronic training load) we end up with the yellow line.
Related News


This is the training-stress balance, or current form.
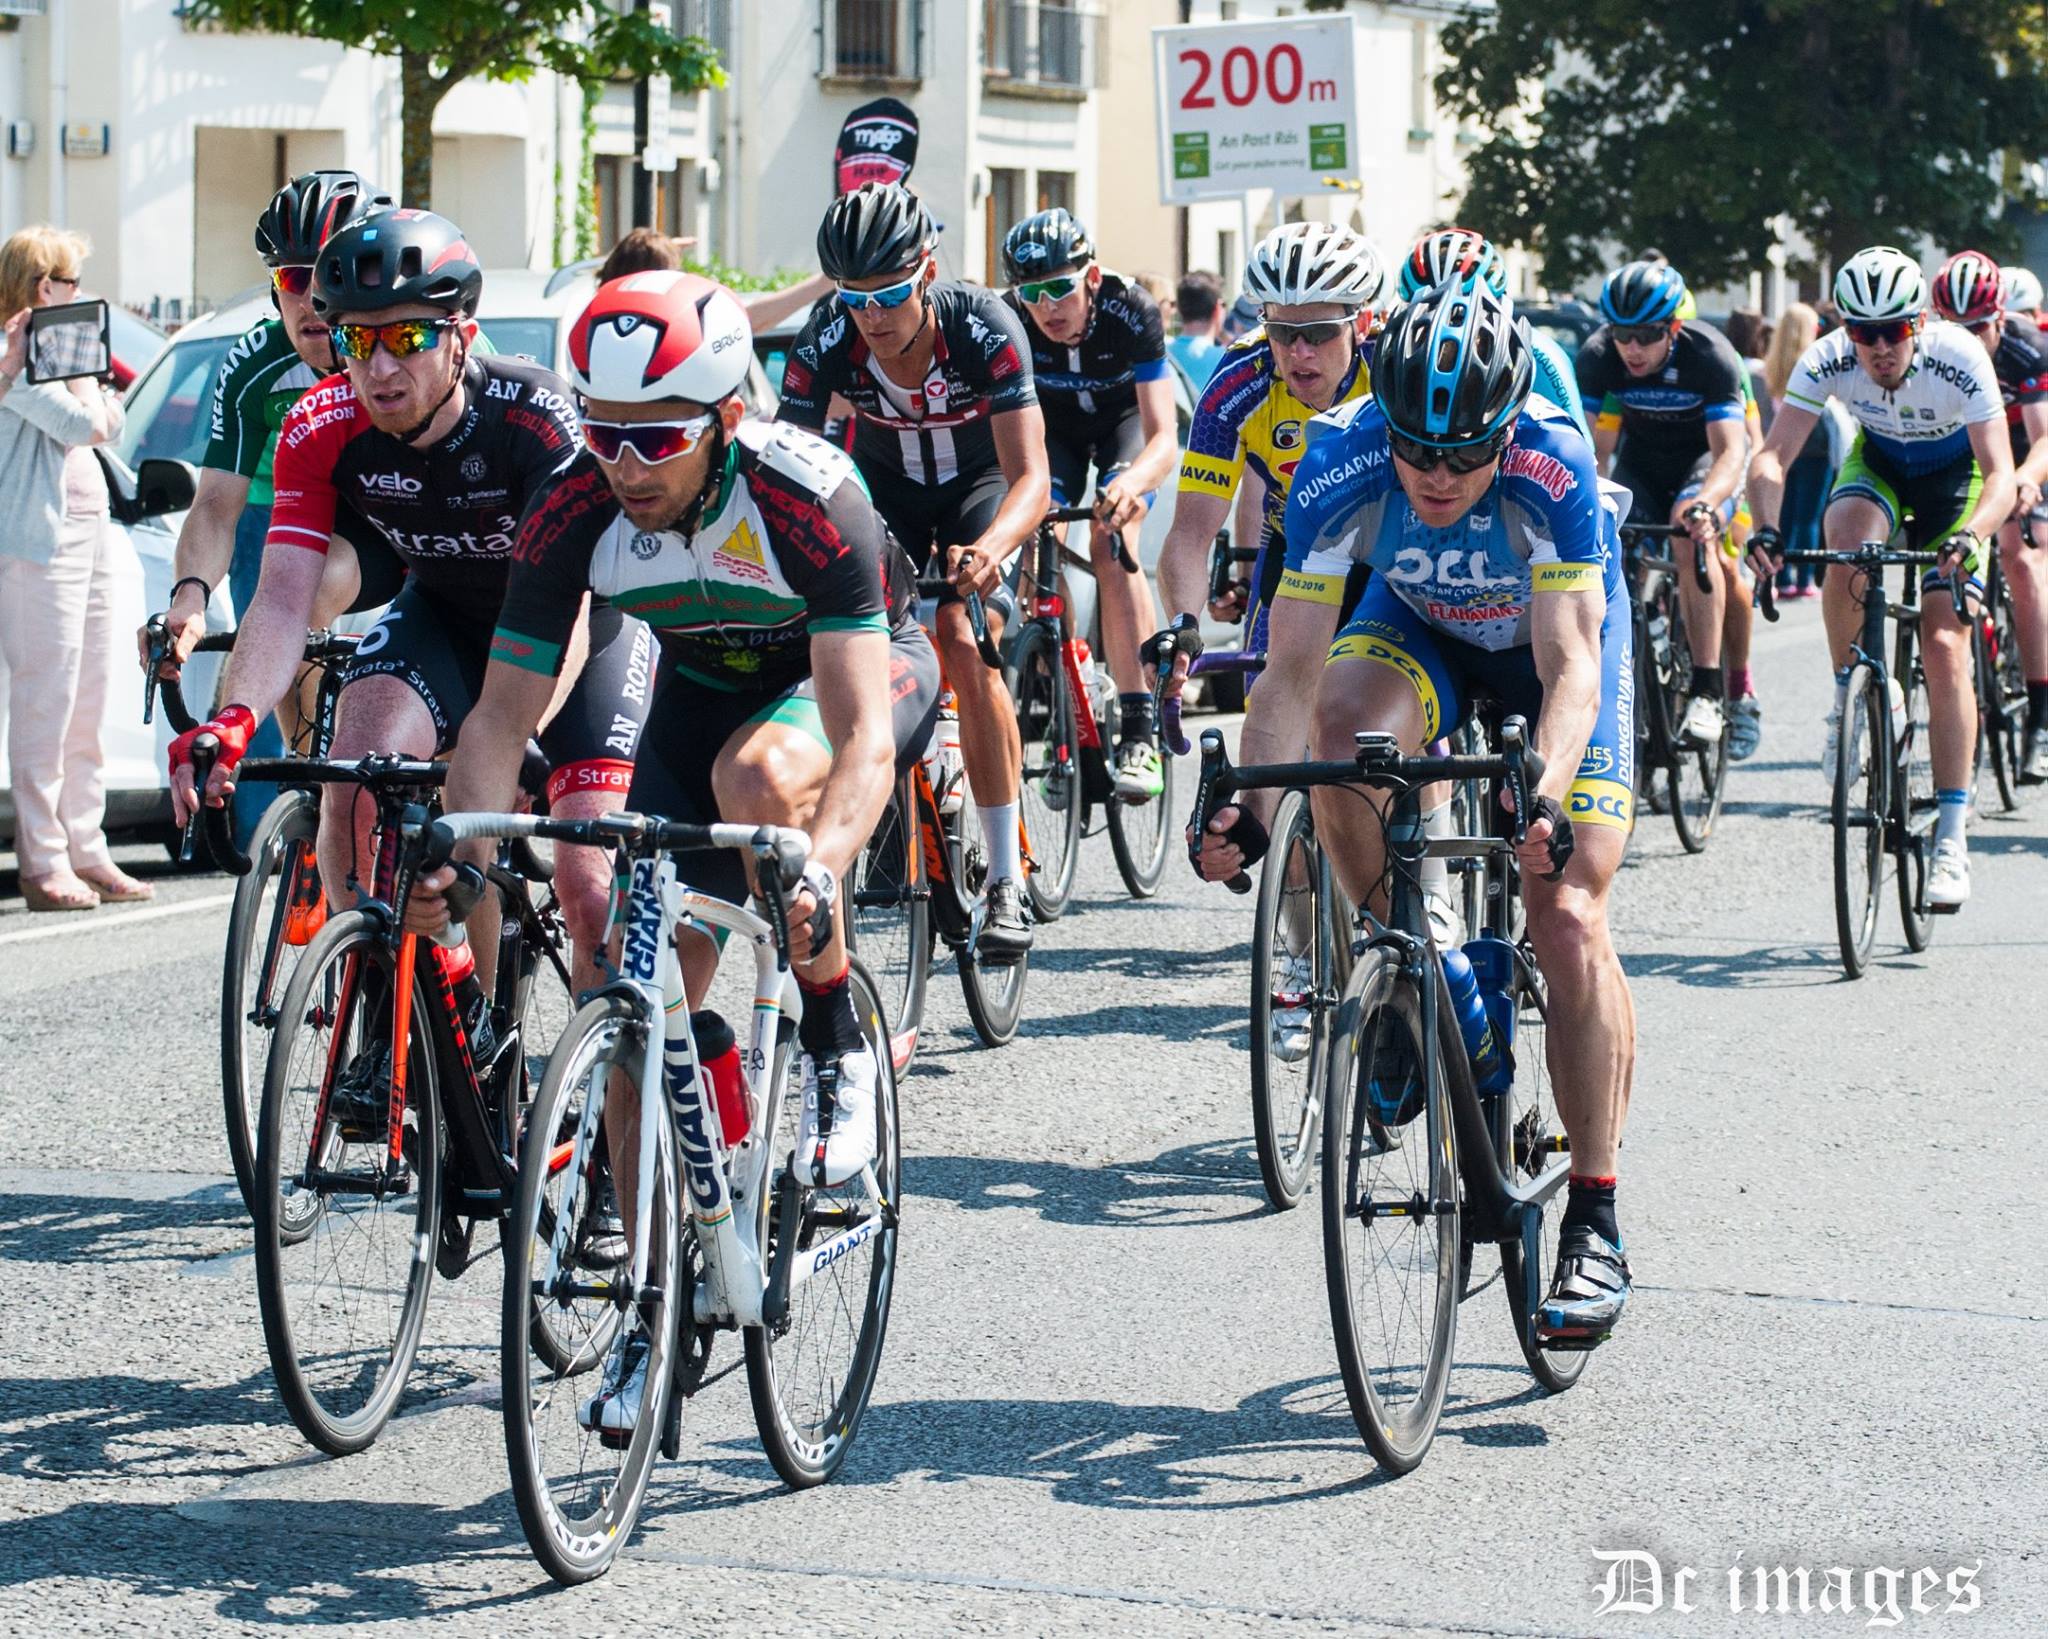
Tadhg de Barra, leading, during the Rás back in May. His main sport is marathon kayaking which he has now returned to (Photo with thanks to DC Images)
De Barra didn’t train like most other riders preparing for the Rás. He opted for several very short focussed sessions per day.
And while he has been in the gym of late trying to get stronger and bigger for kayaking; that kind of training does not significantly impact on this graph.
But his intense cycling training and racing in the early part of the graph is clearly visible, with his physical capacity absolutely plummeting in recent months.
Somebody like him – a very good kayaker with a lifetime of exercise in his body and who is a strong cyclist when he chooses – will reverse those negative trends quite quickly.
But anyone thinking of taking a long break from cycling in winter or who even finds themselves going out on the bike very little, if at all, in December should consider this graph.
If a drop of form like this can take place in a very physically capable athlete and somebody who rode the Rás just six months ago, a prolonged break from cycling for mere mortals (like us – Ed) will be very hard to overcome when we get back on our bikes again.
For cyclists with young kids and perhaps a lot of social commitments around work and family during the festive season, it can be very easy finding yourself only going out for a couple of training rides in December.
But of course, as this graph shows; you need to use it or you’ll lose it.
So try and continue to get out on your bike through winter, even if it means going out alone earlier in the morning than you normally would. Or even if it means going for shorter sharper spins than you are used to.
If one missed club spin turns into six of eight in December, you will have a mountain to climb come January. Don't do it to yourself!


