
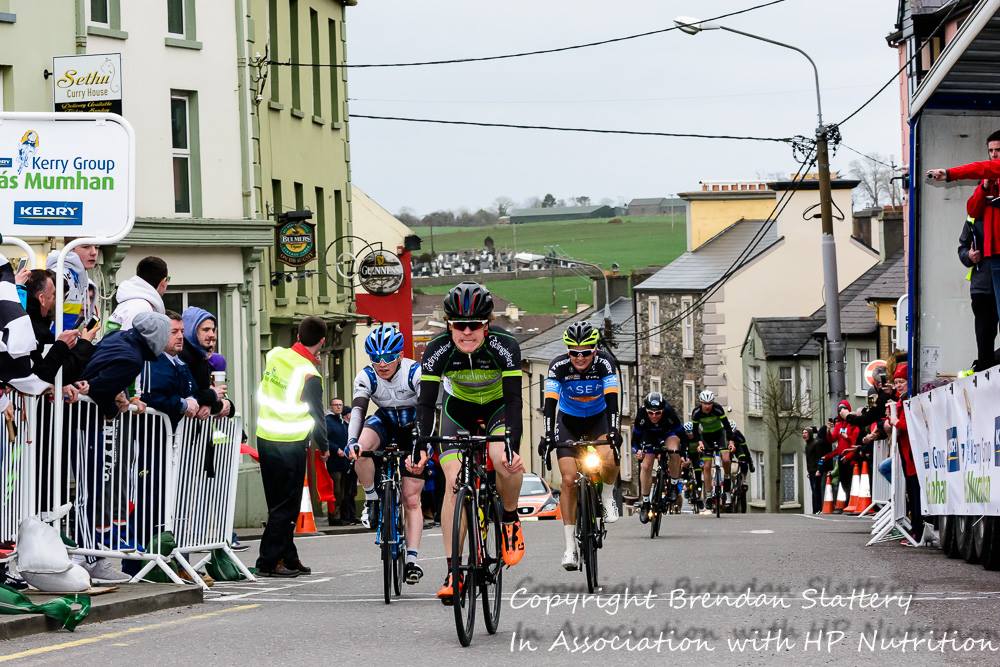
Chris McGlinchey storms home to win the opening stage of the Kerry Group Rás Mumhan last Friday. And now he's released his data for that ride (Photo: Brendan Slattery - HP Nutrition)
By Brian Canty
Chris McGlinchey took the best win of his career last Friday on the opening stage of the Kerry Group Rás Mumhan, sprinting up the hill in Killorglin ahead of his fellow breakaway men.
The Belfast man was one of four Irish riders in the break in what was an impressive debut for three of them; Darragh O’Mahony and Craig Macaulay the other two.
McGlinchey has uploaded his file from the race to Strava and we ran a fine-tooth comb through his numbers so we can see what he’s got in the engine.
Advertisement
Turns out, amongst other things, he’s got a serious ability to suffer, a high ‘cruising’ speed and most importantly for the sake of winning races, a very serious ‘kick’ at the end of 100 kilometres of racing.
Suffering…
Stage 1 of Kerry Group Rás Mumhan is always extremely hard with 180 riders all trying to make the break.
It leads to a lot of nervousness in the bunch and some very high speeds as riders battle to stay at the front.
McGlinchey’s numbers from the day tell the story of a man who really had to work all day – or at least until the final couple of kilometres until he was certain the break would stay away and he could think about winning.
His average speed for the day was 40kph with a maximum of just under 70kph.
His max power reached 1,268 watts, while he averaged an eye-watering 327 watts for the stage.
Given he is between 71 and 72 kilos, that is not bad at all.
For the 2 hours and 22 minutes he was riding, he spent almost a third of it (45 minutes) riding at threshold. This is around 65% of one’s max heart rate. Or, the highest tempo one can sustain for one hour.
More painfully was the 15 minutes McGlinchey spent in an anaerobic state where his heart rate never came below 175 beats per minute.
That is a lot of time in the red!
Killarney to Knocknaboul Cross
This is a 25-kilometre segment that took McGlinchey 38:24, with only Craig Macaulay besting him by eight seconds on the same day.
They rode it an average speed of 37kph which isn’t exactly warp speed but on brutal terrain, it’s pretty significant.
A maximum of just below 70kph is also quite staggering, though we all know how much McGlinchey likes to descend.
Killorglin Ramp
Related News


For his race-winning effort, McGlinchey hit a maximum speed of 50kph and his fine burst to take him over the line produced 1140 watts.
Given he can hit a maximum of 1400 when fresh this was a very important factor in his success.
But for any 70 kilo (ish) rider who thinks they can come to the line and beat McGlinchey, try producing over 1,000 watts after 100 kilometres....
McGlinchey is between 71 and 72kg and is 1.79m in height.
Chris McGlinchey's stage 1 ride in Kerry
Speed: 25.4mph average, 42.9mph maximum
Heart Rate: 161bpm average 185bpm maximum
Cadence: 91 average, 123 maximum
Average Power: 302 Watts
Maximum Power: 1,268 Watts
Distance: 60.3miles
Moving time: 2hrs 22mins 44secs
Elevation: 4,003ft
Calories: 2,887
Temperature: 46℉
Weighted average power: 327 Watts
hen you ride with a power meter, you'll notice how your power jumps all over the place based on the terrain, grade, wind, and other factors. Weighted Average Power looks at all of this variation and provides an average power for your ride that is a better indicator of your effort than simply taking your average power. It is our best guess at your average power if you rode at the exact same wattage the entire ride.
Total work: 2,589kj
Total Work, expressed in kilojoules (kJ), is simply the sum of the watts generated during your ride. There is a close 1–to–1 ratio with 'total work' and 'calories expended' during a ride.
Training load: 187
Strava calculates 'training load' by comparing your power during your ride to your FTP and determining how much load you put on your body during the workout. Training load is a great way to determine how much rest you need after your workouts. A score of 125 or lower takes 24 hours to fully recover from. A score of 125-250 takes about 36 to 48 hours to recover from. A score of 250 to 400 takes at least three days to recover from and a score of 400+ takes at least five days to recover from.
Intensity: 88 per cent
Intensity is Strava’s way of showing how difficult a ride was as compared to a riders function threshold power (FTP). Strava looks at a rider’s weighted average power for the ride and compares it to their FTP. If riders’ weighted average power was 250W and FTP 300W, the intensity would 83%. It's very possible to have an intensity of over 100% if the ride was shorter than an hour. And endurance or recovery ride is 65% or lower. A moderate ride is 65% to 80%. A tempo ride is 80% to 95%. Time trial or race effort is 95% to 105% and short TT or race effort is any score above 105%.
Extreme suffer score: 161
The Strava ‘suffer score’ is an analysis of riders’ heart rate data. By tracking heart rate through a rider’s workout and its level relative to the athlete’s maximum heart rate, Strava attaches a value to show exactly how hard the rider worked. The more time riders spend going full gas and the longer their activity, the higher the score. You can compare your score to others to discover the ‘epicness’ of your ride.
Zone Distribution
Z1 Active Recovery (1 - 203 Watts) for 34mins 08secs, 24% of moving time
Z2 Endurance (204 - 277 Watts) 26mins 20secs, 18% of moving time
Z3 Tempo (278 - 333 Watts) 26mins 20secs, 18% of moving time
Z4 Threshold (334 - 388 Watts) 20mins 35secs, 14% of moving time
Z5 VO2Max (389 - 444 Watts) 14mins 18secs, 10% of moving time
Z6 Anaerobic (445 - 555 Watts) 12mins 20secs, 9% of moving time
Z7 Neuromuscular (555+ Watts) 8mins 40secs, 6% of moving time
Heart rate analysis
Z1 Endurance (less than 139bpm) for 5:24 mins, or 4% of time
Z2 Moderate (139-150bpm) for 13mins 28secs, or 9% of time
Z3 Tempo (150-162bpm) for 1hr 2mins 32secs, or 44% of time
Z4 Threshold (162-175bpm) for 45mins 26secs, or 32% of time
Z5 Anaerobic (higher than 175bpm) for 15:54secs, or 11% of time
Topics


