
It may have been a slow stage 3 at the Tour, but the pros turned it on in the closing stages.
Stephen Gallagher and Philipp Diegner of Dig Deep Coaching have teamed up with @VeloViewer on a fascinating data project for the Tour de France
They bring us this easy to follow top notch analysis of the data from some of the stand-out riders during yesterday's 223.5km stage 3 into Angers.
A lot of the information is contained in two images below and you’ll need to click on them to make them full size and easier to read.
Easy long day with a tough finish
Stage 3 from Granville to Angers was the second longest day of the 2016 Tour and after two tough days in the saddle, the peloton took it relatively easy for most of the day.
Comparing the average and normalised power outputs during yesterday with numbers from the previous day illustrates how the riders were taking a more relaxed approach for the 223.5km stage into Angers.
Advertisement
While Michael Valgren (Tinkoff) rode at an average power of 222W and a normalised power (NP) of 278W (3,83W/kg) on stage 2, yesterday his average and NP reached just 163W and 216W, respectively.
The race winner’s average speed dropped to 37.2km/h on the way to Angers yesterday, with Sagan covering the stage 2 hilly parcours in 42.1km/h.
Peter Stetina (Trek – Segafredo) even called yesterday the “most relaxed stage I’ve ever done”.
Race accelerates going into the final
Related News


Click on image for a larger, easier to read, version
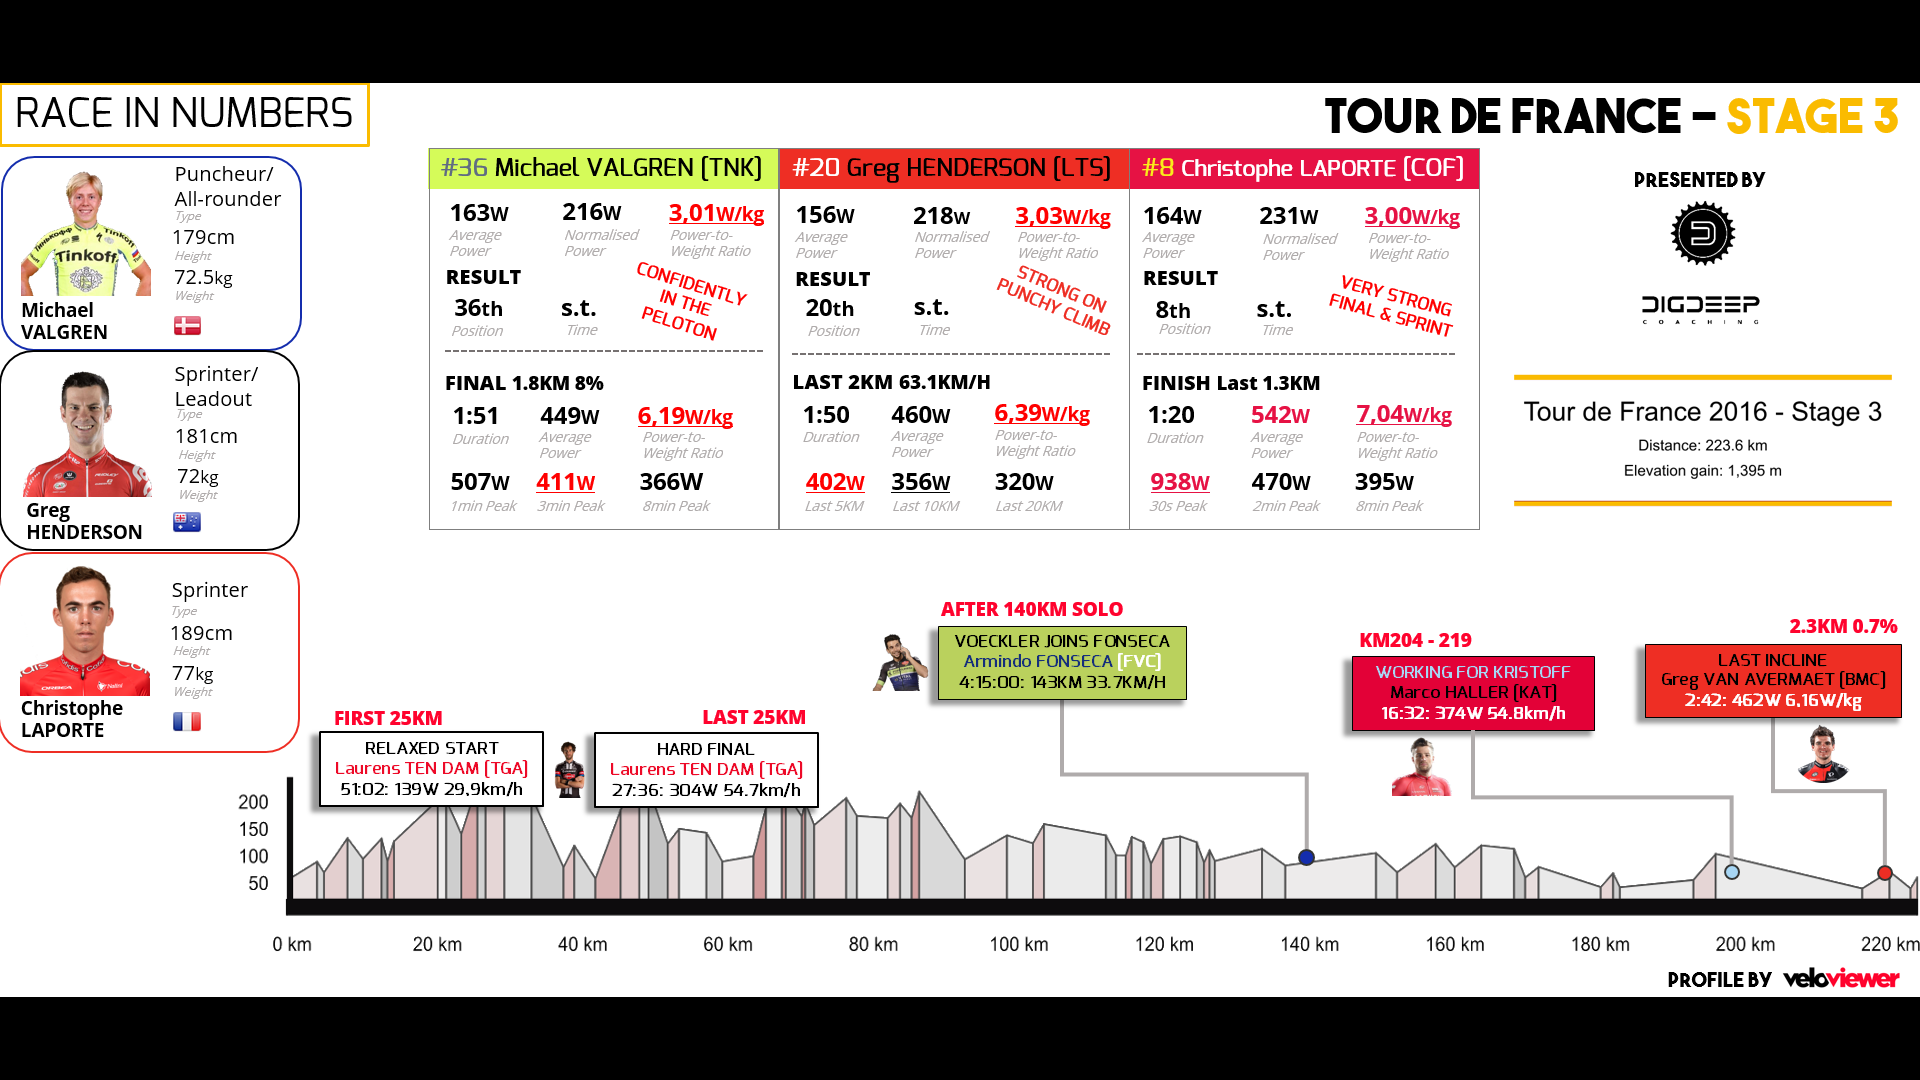
While lone breakaway rider Armindo Fonseca (Fortuneo – Vital Concept) had to work at the front without any support from the start yesterday, the main bunch took its prolonged rest with Laurens Ten Dam (Giant – Alpecin) riding the first 25KM with a mere 29.9km/h (139W).
In contrast, Ten Dam had put out more than 300W in the last 25KM as the speed increased to nearly 55km/h.
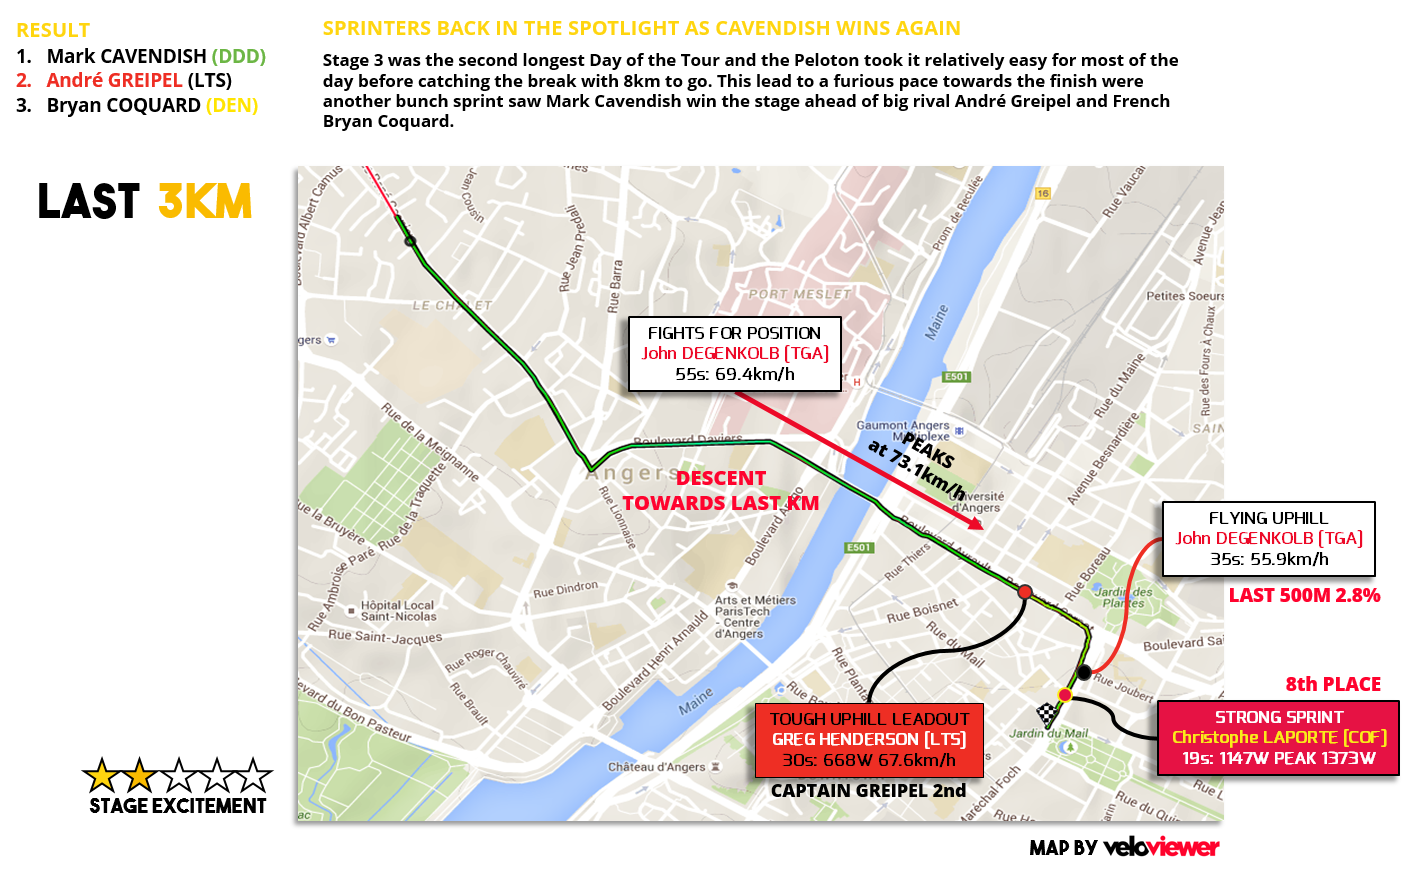
The final was as furious as only Tour de France finishes are.
Lotto-Soudal's Greg Henderson progressively had to ramp up intensity; 356W for the last 10km, 402W for the last 5km and even 460W for the last 2km before peaking with a 668W.
That peak was a 30-second lead-out for André Greipel, who finished 2nd to Mark Cavendish.
The intensity of a Tour de France sprint can also be observed in the stage 3 data by looking at John Degenkolb’s speed in the last 500m - with an incline of 2.8 per cent - which he blasted up in 55.9km/h for a 13th place finish.
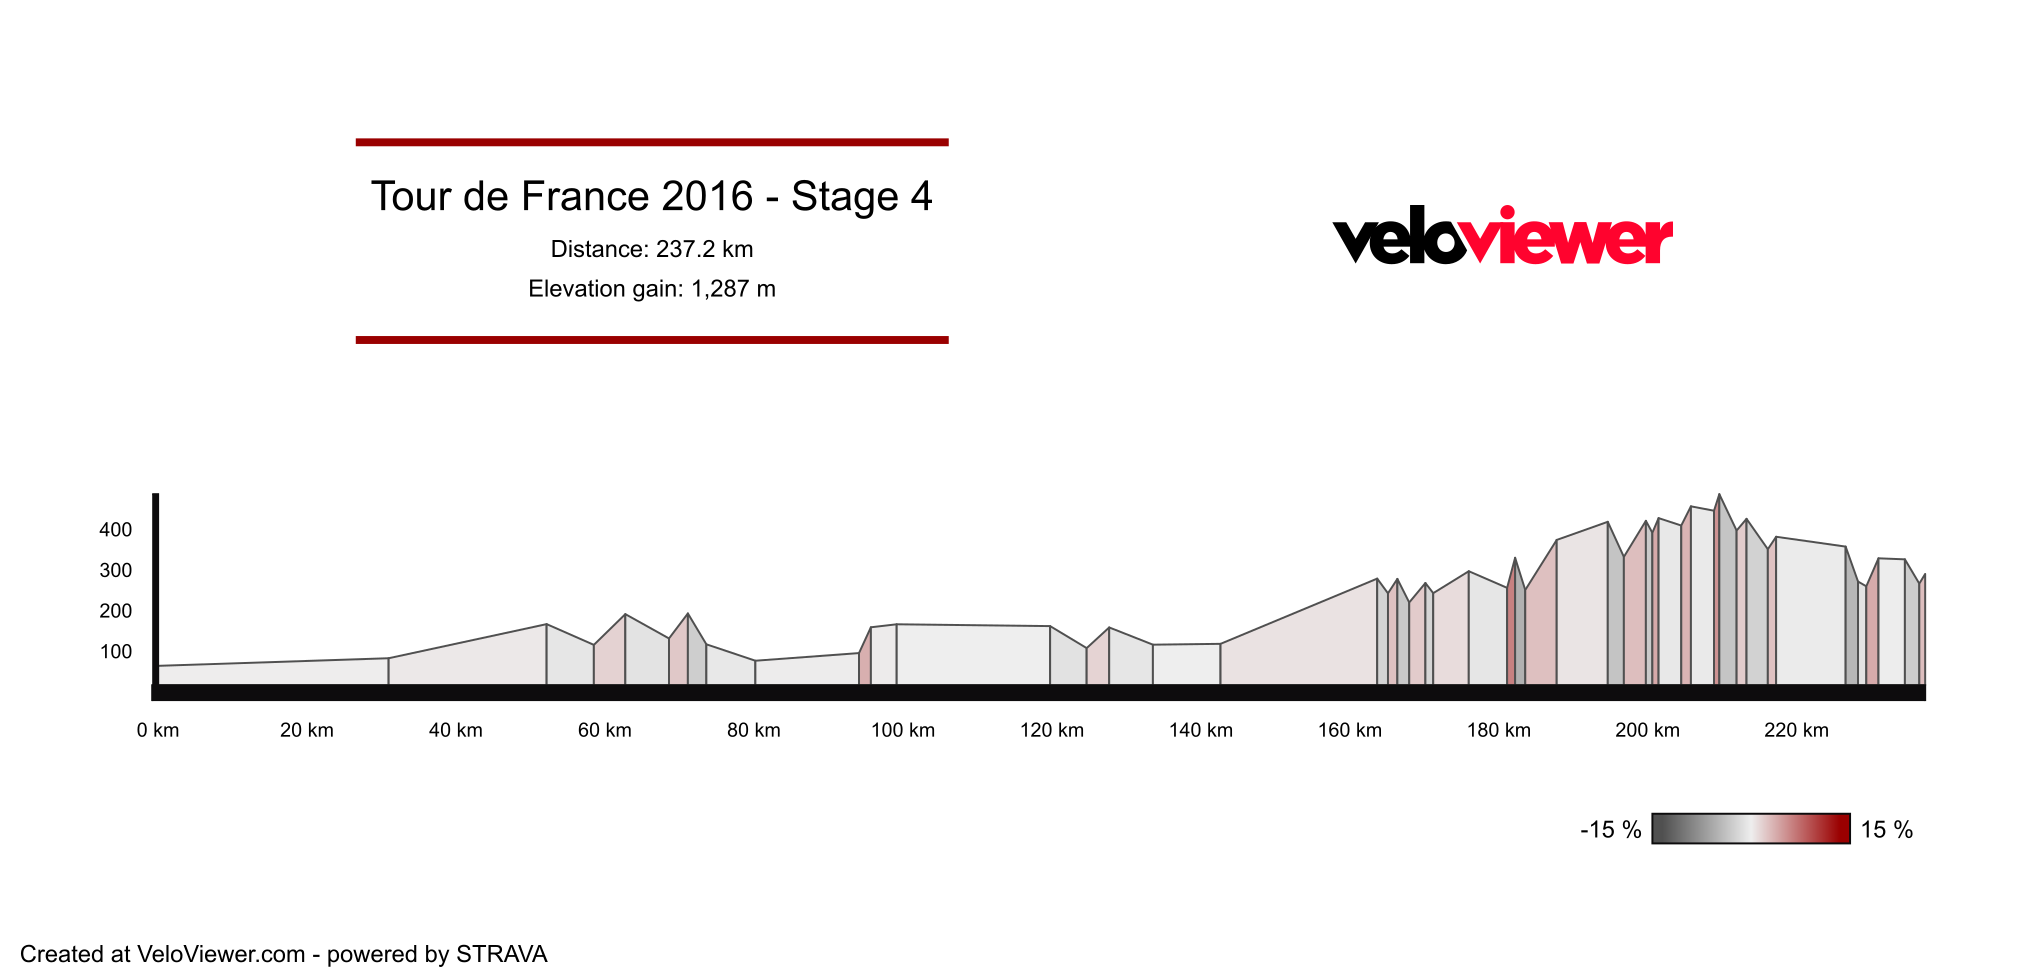
Longest day to come on Stage 4
Today’s stage 4 sees the riders tackle the longest leg of the race, as the field take on a route from Saumur to Limoges.
The first hours can be expected to be relatively slow again before the group hits a lumpier section with about 50km to go.
The pace will inevitably increase and the duration and the toughness of the course might cause some larger gaps for the first time in 2016.
Topics


